
Digestive Health & IBS Statistics 2026
Digestive symptoms affect millions of people and can influence work, sleep, eating, social life, and overall wellbeing. This evidence-focused resource brings together 35 digestive health and IBS statistics covering irritable bowel syndrome, constipation, bloating, abdominal pain, diarrhea, healthcare use, and the wider burden of gastrointestinal disease.
Last reviewed: August 2026 • Sources linked throughout
Quick Answer: Digestive Health Statistics at a Glance
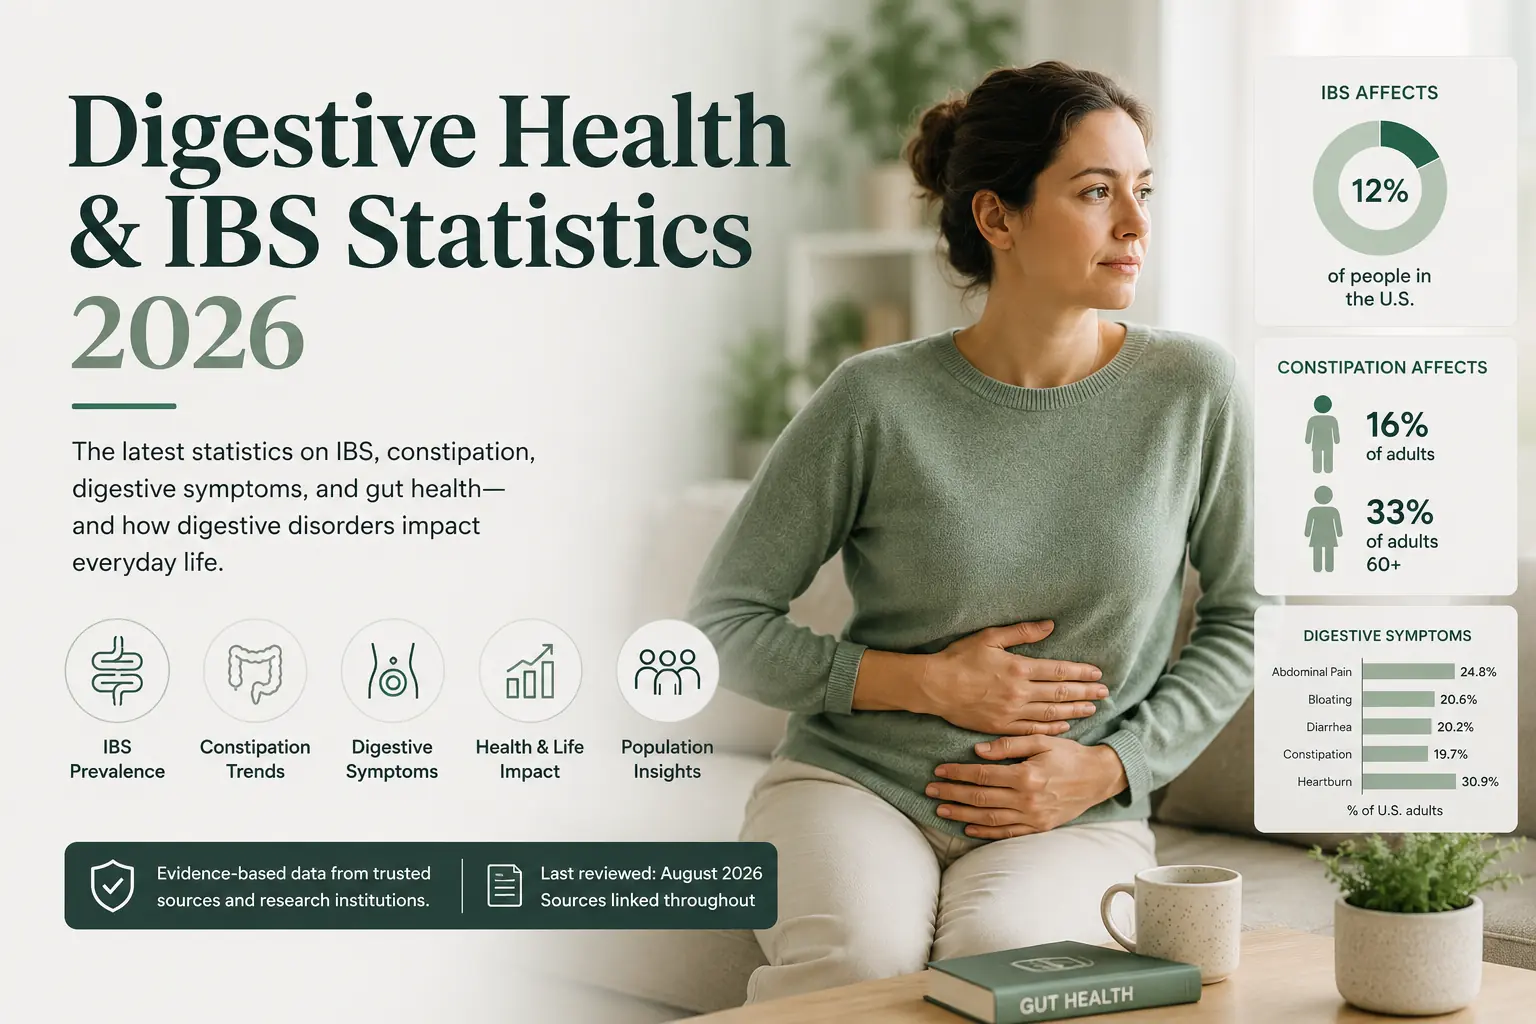
- About 12% of people in the United States have IBS, according to NIDDK.
- Women are up to twice as likely as men to develop IBS.
- About 16% of U.S. adults experience constipation symptoms; the estimate rises to 33% among adults 60 and older.
- In a nationally representative survey of 71,812 Americans, 61% reported at least one GI symptom in the previous week.
- The survey found abdominal pain in 24.8%, bloating in 20.6%, diarrhea in 20.2%, and constipation in 19.7%.
- Digestive-system diseases accounted for 35.4 million U.S. physician-office visits in 2019 and 8.8 million emergency-department visits in 2022 when listed as the primary diagnosis.
IBS Statistics
Irritable bowel syndrome is a disorder of gut-brain interaction characterized by recurring abdominal pain and changes in bowel movements. Estimates vary because studies use different diagnostic criteria, populations, and survey methods.
- About 12% of people in the United States have IBS. This is the prevalence estimate summarized by the National Institute of Diabetes and Digestive and Kidney Diseases (NIDDK). Source: NIDDK.
- Women are up to two times more likely than men to develop IBS. The size of the difference can vary across study populations. Source: NIDDK.
- People younger than 50 are more likely to develop IBS than people older than 50. IBS can occur at any age, but onset is more common earlier in adulthood. Source: NIDDK.
- IBS is classified into three main bowel-pattern subtypes: IBS with constipation (IBS-C), IBS with diarrhea (IBS-D), and IBS with mixed bowel habits (IBS-M).
- In IBS-C, more than 25% of abnormal stools are hard or lumpy and fewer than 25% are loose or watery on days with an abnormal bowel movement. Source: NIDDK.
- In IBS-D, more than 25% of abnormal stools are loose or watery and fewer than 25% are hard or lumpy.
- In IBS-M, more than 25% of abnormal stools are hard or lumpy and more than 25% are loose or watery. Bowel patterns may still vary from day to day.
- A 2005 U.S. community survey estimated IBS prevalence at 14.1% using older diagnostic criteria. Of the 5,009 people screened, 3.3% reported a medical diagnosis and 10.8% met study criteria without a diagnosis. This older estimate should not be treated as directly interchangeable with the NIDDK figure. Source: Hungin et al..
- The same older survey estimated that 76.6% of people meeting its IBS criteria were undiagnosed. Diagnostic criteria and awareness have changed since the study was conducted.
- In that study, 74% of medically diagnosed participants and 63% of undiagnosed participants reported alternating constipation and diarrhea. These figures reflect the study’s older criteria and should not be used as current subtype prevalence estimates.
Constipation Statistics
Constipation is common across age groups, but its prevalence rises substantially among older adults.
- About 16 out of every 100 U.S. adults have symptoms of constipation. Source: NIDDK.
- About 33 out of every 100 adults age 60 and older have constipation symptoms. That is roughly one in three older adults.
- The NIDDK estimate for adults 60+ is more than twice the overall adult estimate—33% compared with 16%.
- Fewer than three bowel movements per week is one clinical feature of constipation. Frequency alone does not define every case.
- Constipation can also involve hard, dry, or lumpy stools even when someone has three or more bowel movements per week.
- Difficulty or pain when passing stool is another recognized feature used alongside frequency and stool consistency.
- A feeling of incomplete evacuation also counts as a constipation symptom. Women, older adults, people consuming little fiber, and people using certain medicines are among the groups more likely to experience constipation.
What Counts as Constipation?
NIDDK describes constipation as potentially involving fewer than three bowel movements weekly, hard or dry stools, difficult or painful passage, or a feeling that stool has not completely passed. Individual bowel patterns differ, so persistent changes or concerning symptoms should be discussed with a healthcare professional.
Bloating, Abdominal Pain & Digestive Symptom Statistics
A large nationally representative U.S. survey provides a useful snapshot of how common gastrointestinal symptoms are. It included 71,812 adults and asked about symptoms during the previous week.
- 61% of surveyed Americans reported at least one GI symptom in the previous week. Source: Almario et al., 2018.
- Heartburn or reflux was reported by 30.9%. It was the most commonly reported symptom in the survey.
- Abdominal pain was reported by 24.8%.
- Bloating was reported by 20.6%. That is about one in five respondents.
- Diarrhea was reported by 20.2%.
- Constipation was reported by 19.7%. This survey’s one-week symptom measure differs from NIDDK’s broader constipation prevalence estimate.
- Nausea or vomiting was reported by 9.5%, dysphagia by 5.8%, and bowel incontinence by 4.8%.
| Digestive symptom | Reported prevalence |
|---|---|
| Heartburn/reflux | 30.9% |
| Abdominal pain | 24.8% |
| Bloating | 20.6% |
| Diarrhea | 20.2% |
| Constipation | 19.7% |
| Nausea/vomiting | 9.5% |
| Dysphagia | 5.8% |
| Bowel incontinence | 4.8% |
Source: Almario CV et al. American Journal of Gastroenterology, 2018. Symptoms were self-reported for the previous seven days; the figures are not diagnosis rates.
IBS and Everyday Life
IBS is not only a bathroom issue. Symptoms may affect work attendance, productivity, eating choices, social plans, sleep, and emotional wellbeing.
- In a 2005 U.S. study, participants with IBS reported an average of 6.4 days off work, compared with 3.0 days among people without IBS over the study’s assessed period.
- The IBS group reported more than twice as many days away from work as the comparison group in that study. Because the research is older, it is evidence of burden—not a 2026 workforce estimate.
- Most people meeting the study’s IBS criteria were undiagnosed. This suggests population burden may extend beyond people represented in medical records.
- People with IBS also reported more days in bed and greater reductions in normal activities than participants without IBS. The study concluded that IBS had substantial wellbeing and socioeconomic effects. Source: Hungin et al., 2005.
Digestive Health and Healthcare Use
Broader digestive disease data helps show why digestive health is a major public-health and healthcare issue.
- Digestive-system diseases accounted for 35.4 million U.S. physician-office visits as the primary diagnosis in 2019. Source: CDC/NCHS.
- Digestive-system diseases accounted for 8.8 million U.S. emergency-department visits as the primary diagnosis in 2022.
- The physician-office total was about four times the emergency-department total, although the datasets cover different years and care settings.
- CDC reports 14.8 million U.S. adults had diagnosed ulcers in 2018, representing 5.9% of adults.
Gut Health Statistics Beyond IBS
- CDC estimates that 2.4 million to 3.1 million people in the United States have IBD, depending on the data source. Source: CDC.
- Administrative claims data estimate 2.4–2.8 million U.S. IBD patients, while national survey data estimate up to 3.1 million adults. This is an example of how methodology changes prevalence estimates.
- U.S. IBD-related healthcare costs were estimated at about $8.5 billion in 2018. Prescribed medicines represented 71% of the total, inpatient visits 18%, office-based visits 9%, and emergency visits 2%.
What These Digestive Health Statistics Tell Us
Digestive symptoms are extremely common. The 71,812-person survey found that nearly two in three respondents experienced at least one GI symptom in a single week. However, symptoms are not the same as diagnosed disease.
IBS affects a substantial share of the population. NIDDK’s summary estimate is about 12% of people in the United States, with women and adults under 50 more likely to develop it.
Constipation becomes particularly common with age. NIDDK estimates that prevalence rises from 16% among all adults to 33% among adults age 60 and older.
The impact extends beyond symptoms. Older research connects IBS with missed work and reduced daily activity, while CDC data show the wider healthcare burden associated with digestive diseases.
Methodology matters. Diagnosis-based records, symptom surveys, telephone screening, and administrative claims measure different things. Good reporting should name the population, measure, and collection year rather than presenting every figure as directly comparable.
Digestive Health Statistics FAQ
How common is IBS in the United States?
NIDDK reports that studies suggest about 12% of people in the United States have IBS.
What percentage of adults have IBS?
The widely cited NIDDK estimate is about 12% of the U.S. population. Estimates vary according to diagnostic criteria and study methodology.
Is IBS more common in women or men?
NIDDK reports that women are up to twice as likely as men to develop IBS.
How common is constipation?
About 16 out of every 100 U.S. adults experience constipation symptoms, according to NIDDK.
How common is constipation after age 60?
NIDDK estimates that about 33 out of every 100 adults age 60 and older have constipation symptoms.
How many Americans experience digestive symptoms?
In a nationally representative survey of 71,812 U.S. adults, 61% reported at least one gastrointestinal symptom during the previous week.
What are the most common digestive symptoms?
In the 2018 survey, heartburn or reflux was most common, followed by abdominal pain, bloating, diarrhea, and constipation.
Is bloating common?
Yes. Bloating was reported by 20.6% of participants in the large one-week U.S. symptom survey—about one in five respondents.
Is IBS the same as IBD?
No. IBS is a disorder of gut-brain interaction without visible digestive-tract damage. IBD refers primarily to Crohn’s disease and ulcerative colitis and involves chronic inflammation.
How does IBS affect quality of life?
Studies associate IBS with missed work, reduced activity, days spent in bed, eating restrictions, and social or emotional effects. Individual experiences vary.
Methodology
Purely Vital Living prioritizes original and authoritative sources in this order:
- Government datasets and public-health agencies
- NIH and NIDDK health information
- CDC and National Center for Health Statistics data
- Peer-reviewed population research
- Major professional medical organizations
“2026” refers to the year this resource was reviewed and updated, not necessarily the year every underlying dataset was collected. Authoritative digestive-health datasets are often released after a delay. Each statistic is presented with its source year or study context where that distinction matters.
Prevalence estimates should not automatically be compared when studies use different diagnostic criteria, populations, recall periods, or data-collection methods.
Sources & References
- NIDDK — Definition & Facts for Irritable Bowel Syndrome
- NIDDK — Definition & Facts for Constipation
- CDC/NCHS — Digestive Diseases FastStats
- CDC — IBD Facts and Statistics
- Almario CV et al. Burden of Gastrointestinal Symptoms in the United States. American Journal of Gastroenterology. 2018.
- Hungin APS et al. Irritable bowel syndrome in the United States: prevalence, symptom patterns and impact. 2005.
This resource is for educational purposes only and is not a substitute for professional medical advice, diagnosis, or treatment. Seek medical care for persistent symptoms, blood in stool, unexplained weight loss, severe pain, fever, dehydration, or other concerning changes.