
Quick Answer
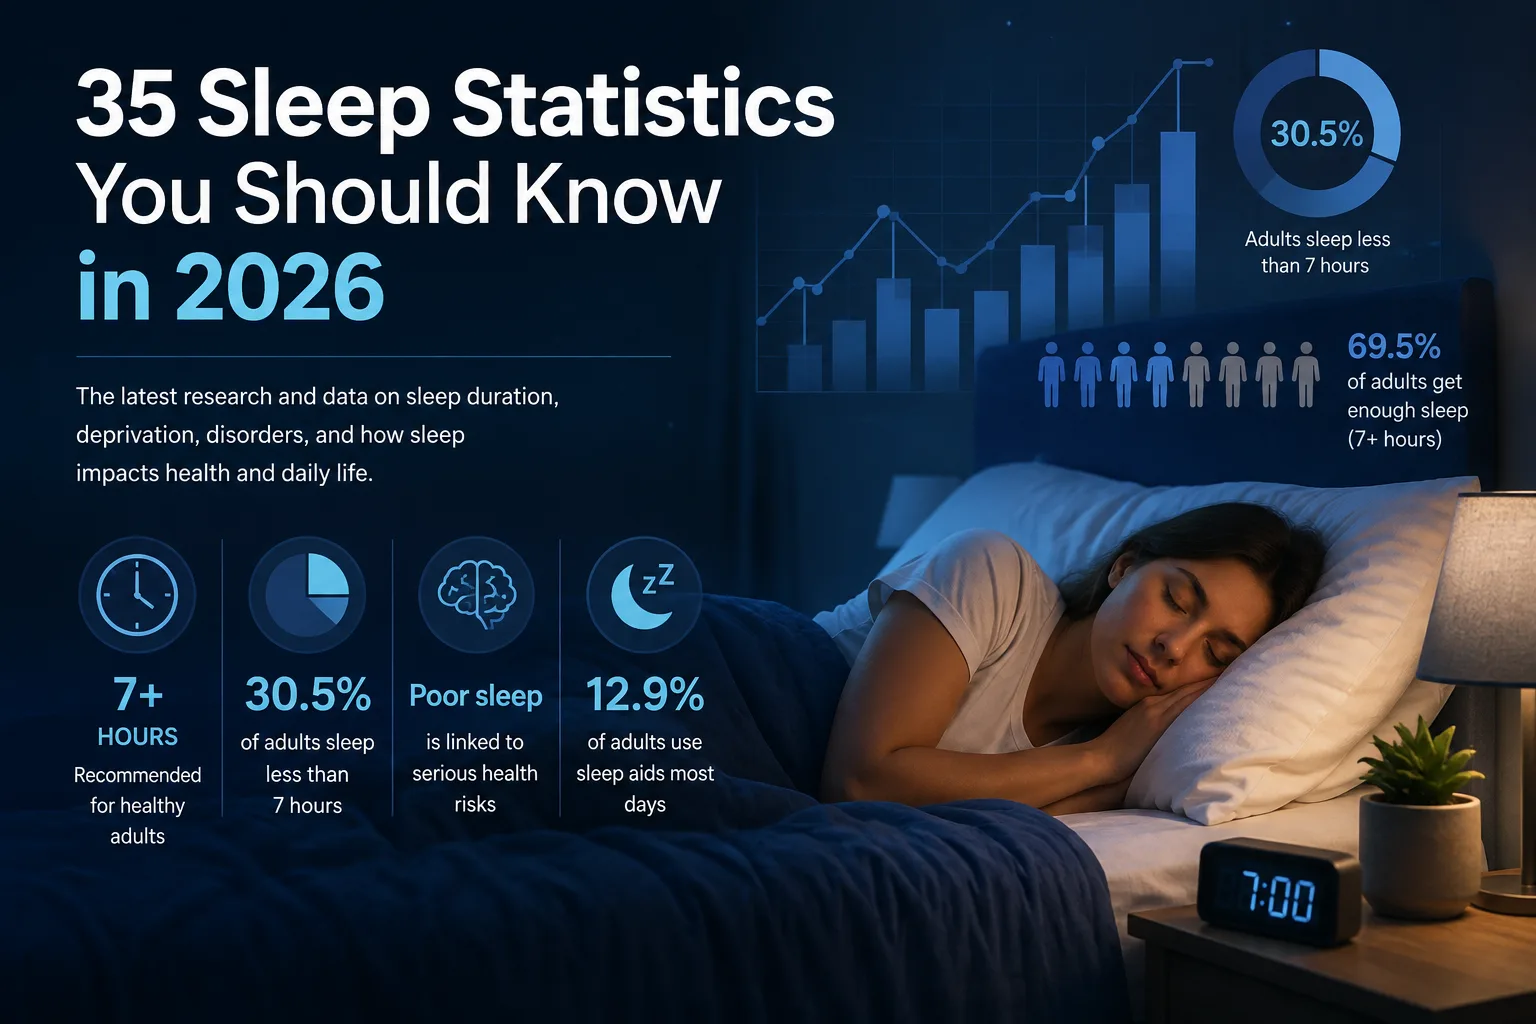
Sleep statistics for 2026 show that 30.5% of U.S. adults slept less than seven hours in 2024. About 15.4% regularly had trouble falling asleep, 18.1% had trouble staying asleep, and 12.9% used a sleep aid most days or every day. Sleep patterns varied substantially by age, sex, and race or ethnicity.
Sleep is essential for physical health, mental well-being, safety, and daily performance. Yet national data show that millions of Americans regularly sleep too little or struggle to fall or stay asleep.
This collection presents 35 sleep statistics you should know in 2026. It covers adult sleep duration, sleep deprivation, insomnia symptoms, sleep apnea, sleep-aid use, and adolescent sleep. Most figures come from the latest available U.S. government data, including the CDC’s analysis of the 2024 National Health Interview Survey.
How to Read These Sleep Statistics
Publication year and data year are not always the same. For example, CDC reports released in 2026 analyze responses collected in 2024. Each statistic below identifies the relevant data year.
Important distinction: trouble falling or staying asleep is an insomnia symptom, but it is not automatically a clinical diagnosis of insomnia disorder. Survey estimates are also generally self-reported unless stated otherwise.
Adult Sleep Duration and Sleep Deprivation Statistics
130.5% of U.S. adults slept less than seven hours
In the 2024 National Health Interview Survey, 30.5% of adults reported averaging under seven hours of sleep in a 24-hour period.
Source: CDC/NCHS, 2024 NHIS
269.5% of adults obtained sufficient sleep
The corresponding national estimate shows that 69.5% of adults aged 18 and older received sufficient sleep in 2024.
Source: CDC Sleep Health FastStats
3Short sleep was nearly identical among men and women
In 2024, 30.6% of men and 30.4% of women slept less than seven hours on average.
Source: CDC/NCHS
427.2% of adults ages 18–34 had short sleep duration
Just over one-quarter of younger adults reported getting less than seven hours per 24-hour period.
Source: CDC/NCHS
533.4% of adults ages 35–49 slept under seven hours
Short sleep duration affected approximately one in three adults in this age group in 2024.
Source: CDC/NCHS
6Adults ages 50–64 had the highest age-group estimate
Among the four age groups reported, adults ages 50–64 had the highest prevalence of short sleep duration at 34.5%.
Source: CDC/NCHS
727.2% of adults 65 and older slept under seven hours
The short-sleep estimate for adults 65 and older was lower than the estimates for adults ages 35–64.
Source: CDC/NCHS
840.2% of Black adults reported short sleep
Non-Hispanic Black adults had a higher short-sleep prevalence than the other race and Hispanic-origin groups in the 2024 report.
Source: CDC/NCHS
927.9% of Asian adults reported short sleep
The estimate for non-Hispanic Asian adults was 27.9% in 2024.
Source: CDC/NCHS
1028.9% of White adults reported short sleep
For non-Hispanic White adults, the national short-sleep estimate was 28.9%.
Source: CDC/NCHS
1129.0% of Hispanic adults reported short sleep
The prevalence among Hispanic adults was 29.0% in the same survey.
Source: CDC/NCHS
12BRFSS measured adult short sleep at 36.8% in 2022
A different CDC survey, the Behavioral Risk Factor Surveillance System, estimated age-adjusted insufficient sleep at 36.8% in 2022. Differences in survey design and methodology mean this should not be treated as directly interchangeable with the 2024 NHIS figure.
Source: CDC BRFSS Sleep FastStats
13Short sleep varied from 30% to 46% by state
In 2022 BRFSS data, insufficient sleep ranged from about 30% of adults in Vermont to 46% in Hawaii.
Source: CDC BRFSS Sleep FastStats
Sleep Quality and Insomnia Statistics
1454.8% of adults usually woke feeling well-rested
Only a little more than half of adults said they woke up feeling well-rested every day or most days in 2024.
Source: CDC/NCHS
15Asian adults were most likely to wake well-rested
Among the reported race and Hispanic-origin groups, non-Hispanic Asian adults had the highest estimate at 61.5%.
Source: CDC/NCHS
1615.4% of adults regularly had trouble falling asleep
About one in six adults reported trouble falling asleep most days or every day during the previous 30 days.
Source: CDC/NCHS
1718.5% of women regularly had trouble falling asleep
Women were more likely than men to report frequent difficulty initiating sleep.
Source: CDC/NCHS
1812.2% of men regularly had trouble falling asleep
The comparable estimate for men was 12.2%.
Source: CDC/NCHS
19Difficulty falling asleep declined with age
Frequent trouble falling asleep decreased from 18.3% among adults ages 18–34 to 12.8% among adults 65 and older.
Source: CDC/NCHS
2018.1% of adults regularly had trouble staying asleep
Just under one in five adults reported trouble maintaining sleep most days or every day.
Source: CDC/NCHS
2121.4% of women regularly had trouble staying asleep
Frequent middle-of-the-night waking or difficulty maintaining sleep was reported by more than one in five women.
Source: CDC/NCHS
2214.6% of men regularly had trouble staying asleep
Men were less likely than women to report frequent difficulty maintaining sleep.
Source: CDC/NCHS
23Staying asleep was hardest for adults ages 50–64
In 2024, 22.3% of adults ages 50–64 reported trouble staying asleep most days or every day, compared with 12.7% of adults ages 18–34.
Source: CDC/NCHS
24Chronic insomnia disorder affects about 10% of U.S. adults
A peer-reviewed national survey paper summarizes prior estimates indicating that roughly one in ten U.S. adults has chronic insomnia disorder, while a larger share experiences individual insomnia symptoms.
Sleep-Aid Statistics
2512.9% of adults regularly used a sleep aid
In 2024, 12.9% of U.S. adults used some type of sleep aid most days or every day to help them fall or stay asleep.
Source: CDC/NCHS Sleep Aids Report
265.2% used prescription sleep medication
Approximately one in twenty adults regularly used prescription medication as a sleep aid in 2024.
Source: CDC/NCHS
275.7% used an OTC medication or supplement
Over-the-counter medications and supplements were used for sleep most days or every day by 5.7% of adults.
Source: CDC/NCHS
283.7% used marijuana or CBD products for sleep
This estimate includes adults who used marijuana or cannabidiol products most days or every day to help with sleep.
Source: CDC/NCHS
29Women used sleep aids more often than men
In 2024, 14.8% of women and 10.8% of men used any sleep aid most days or every day.
Source: CDC/NCHS
30Regular sleep-aid use increased with age
Use of any sleep aid rose from 10.5% among adults ages 18–34 to 15.8% among adults 65 and older. Marijuana or CBD use for sleep moved in the opposite direction, declining from 5.5% to 1.7% across those age groups.
Source: CDC/NCHS
Teen Sleep Statistics
31Only about one in four high school students got eight hours of sleep
CDC’s 2023 Youth Risk Behavior Survey found that roughly 25% of high school students received at least eight hours on an average school night.
Source: CDC YRBS, 2023
32Teen sleep adequacy declined from 2013 to 2023
The proportion of high school students obtaining at least eight hours of sleep on an average school night decreased over the ten-year period.
Source: CDC YRBS Trends Report
Sleep Apnea Statistics
33Obstructive sleep apnea affects more than 24 million U.S. adults
An NHLBI research feature reports that obstructive sleep apnea affects more than 24 million adults in the United States.
Source: NHLBI/NIH
34Up to 90% of obstructive sleep apnea cases may be undiagnosed
The same NHLBI report states that most cases remain undiagnosed, highlighting the large gap between estimated prevalence and confirmed diagnosis.
Source: NHLBI/NIH
How Much Sleep Do Adults Need?
35Adults generally need at least seven hours of sleep
CDC guidance recommends at least seven hours for adults ages 18–60, seven to nine hours for adults ages 61–64, and seven to eight hours for adults 65 and older.
Source: CDC About Sleep
| Age group | Recommended daily sleep |
|---|---|
| Adults 18–60 | 7 or more hours |
| Adults 61–64 | 7–9 hours |
| Adults 65+ | 7–8 hours |
What Do the 2026 Sleep Statistics Tell Us?
The latest sleep health statistics show that insufficient sleep remains common, but duration alone does not describe the entire problem. Many adults who spend enough time in bed still struggle to fall asleep, remain asleep, or wake feeling restored.
The data also reveal meaningful differences across demographic groups. Those differences should be interpreted as signals for further investigation—not as evidence that race, sex, or age alone causes poor sleep. Work schedules, caregiving, health conditions, stress, neighborhood conditions, access to care, and many other factors can influence sleep.
If you regularly struggle with sleep, explore PVL’s guides to improving sleep quality naturally, waking during the night, and the PVL Sleep Score Calculator.
Frequently Asked Questions
How many adults don’t get enough sleep?
According to the 2024 National Health Interview Survey, 30.5% of U.S. adults averaged less than seven hours of sleep in a 24-hour period. Another CDC survey using different methods estimated 36.8% in 2022, so the figure varies by dataset.
What is the average sleep time for adults?
The most current CDC report emphasizes the percentage above or below the seven-hour threshold rather than publishing one universal mean. Individual sleep needs vary, but adults generally need at least seven hours, with age-specific ranges for older adults.
How common is insomnia?
In 2024, 15.4% of adults reported trouble falling asleep and 18.1% reported trouble staying asleep most days or every day. These are symptom estimates. Chronic insomnia disorder is more narrowly defined and is estimated to affect about 10% of U.S. adults.
How common is sleep apnea?
NHLBI reports that obstructive sleep apnea affects more than 24 million U.S. adults and that as many as 90% of cases may remain undiagnosed.
Are sleep statistics self-reported?
Many national sleep-duration and sleep-difficulty statistics are based on self-reported survey responses. This allows large population estimates but can differ from objectively measured sleep obtained through wearable devices or laboratory testing.
Citing This Page
You’re welcome to cite this research summary. For individual statistics, please review and cite the original source linked beside the figure.
Suggested attribution: Purely Vital Living Research & Statistics, “35 Sleep Statistics You Should Know in 2026.”
Sources and Methodology
- CDC/NCHS: Short Sleep Duration and Sleep Difficulties Among Adults—United States, 2024
- CDC/NCHS: Use of Sleep Aids Among Adults—United States, 2024
- CDC: FastStats—Sleep in Adults
- CDC: Youth Risk Behavior Survey Sleep Trends
- NHLBI: Diagnosing Obstructive Sleep Apnea at Home
- Journal of Clinical Sleep Medicine: National Survey of Insomnia Care
Editorial review: Statistics were checked against the linked source pages in August 2026. Percentages may be rounded. Survey years and publication years are identified where relevant.
← Return to Wellness Research & Statistics
This resource is for educational purposes and is not a substitute for professional medical advice.